
Public health decisions are important enough that I need to be accountable to you in my methodology. As a Mayor, I'm finding that one of the key challenges of this coronavirus pandemic is data analysis. Public health experts are tracking vital metrics such as "Serotology Positive", "PCR Positive", total death count, daily deaths, total recoveries, and the number of ICU beds available. As a local government decision-maker, though, what I really need to know is, "What's our current rate of spread, and is it increasing or decreasing?". Knowing that helps me determine what City actions and communication should be pursued on any given day.
The Metric that Matters
The metric most useful to me -- and what I'll broadcast to the public -- is "Number of confirmed new cases per day". This number is much more relevant than the total number of cases since February. If the daily new confirmed cases are increasing, then we should be more strict in our containment protocols (or at least communicate them to the public more insistently). If the number's consistently decreasing day-by-day, then our protocols are likely working, and at some point, we can relax some protocols.
Proportional Scaling
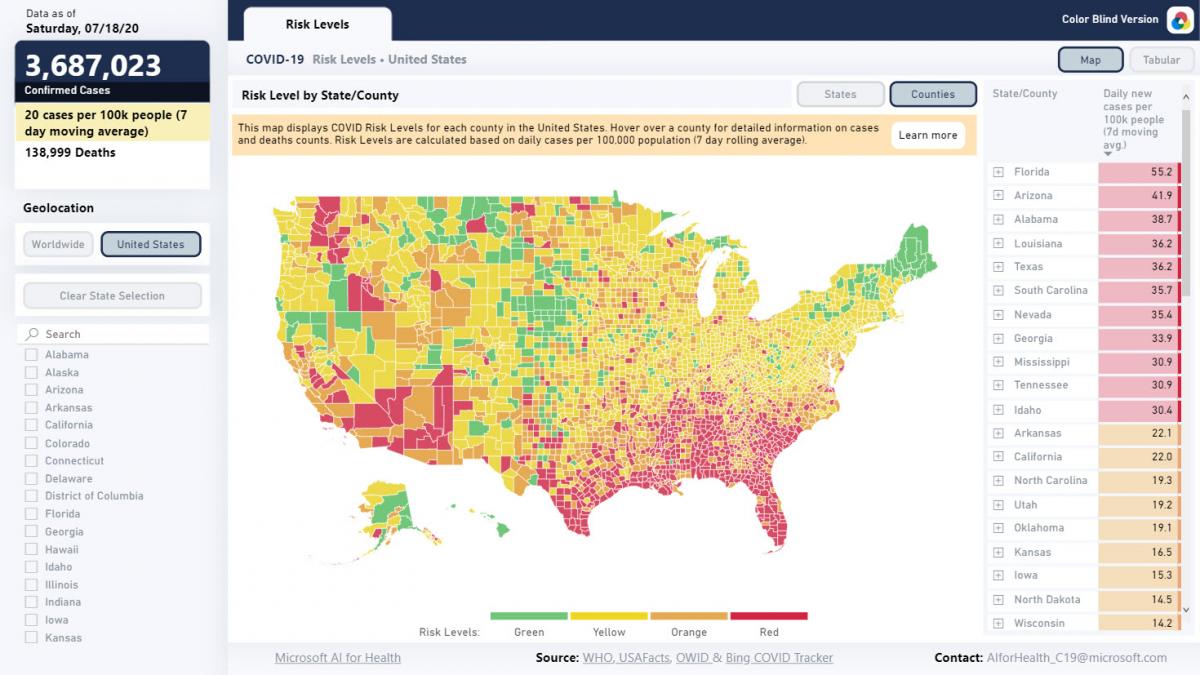
For an apples-to-apples comparison with other counties, proportional totals are much more helpful than actual totals. 20 new cases in a county with 10,000 people should be more concerning than 20 new cases in a county of 500,000 -- the rate of infection is far lower in the second case. Meaning, if you had 20 new cases in a county of 500,000, your rate per 100K is "4.0" (20 divided by 5). In contrast, 20 daily new cases in a county of10,000 give a rate per 100K of "200.0" (20 times 10). With that proportional scale, it's easier to collaborate with other governmental and non-governmental organizations to develop workable containment protocols.
One-Week Averaging
We often see the daily new cases from the previous day. Multi-day averaging provides a more accurate picture of the overall trend because it smooths out high-low spikes that occur when one day's test results are delayed to the next day. A seven-day rolling average accounts for a full weekday-weekend cycle, which "smooths out the bumps".
When Do We Reach A High Risk Level?
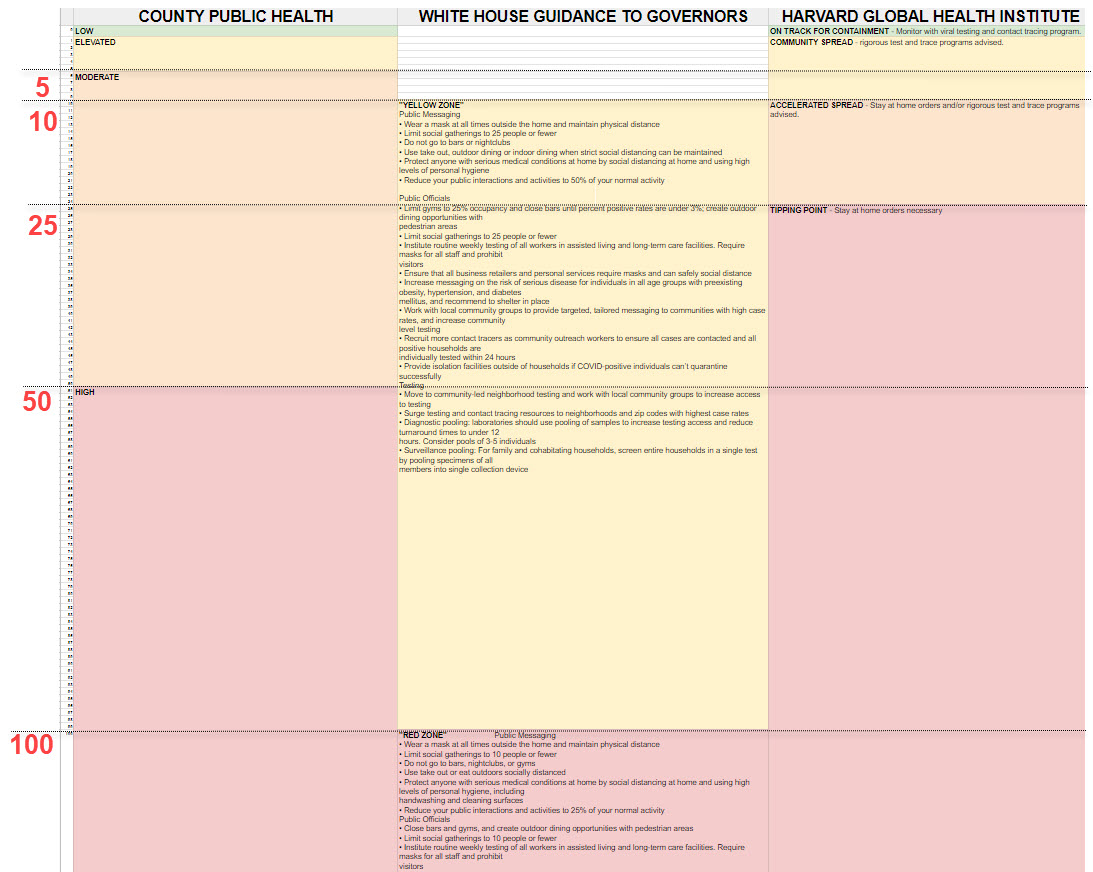
It's an important public policy question: How many new daily cases must occur before a population area (a city, or a county) has crossed into the realm of uncontrollable spread where significant action is required? I've seen three very reputable, data-driven resources use very different numbers:
- The Harvard Global Health Institute (HGHI): "Tipping Point" is listed as 25 new daily cases per 100K population on a 7 day rolling average
- Blackhawkcovid19.com: "High Risk" is listed as 50 new daily cases per 100K population on a 14 day rolling average
- White House Guidance to Governors: "Red Zone" is listed as 100 new daily cases per 100K population on 14 day rolling average, plus a test positivity rate of more than 5%.
When mapped out, it looks like this:
Working to be On the Same Page
Mayors are responsible for public safety in the cities we're elected to serve. We can't outsource or abdicate that responsibility. The County, State, and Federal resources all serve a purpose, and I've expressed my concerns about the varying interpretations to our County Public Health Director, Dr. Nafissa Cisse Egbuonye, as well as to Black Hawk County Sheriff Tony Thompson, who chairs our County Emergency Management Commission (of which I'm a member). I've explained my logic to them and have received assurances that the county services exist to support local leaders...so while it's ideal to always be on the same page, I won't be "voiding the warranty" if Cedar Falls is broadcasting metrics that differ slightly from the County Public Health Department. I respect the county's resources, and still refer to it for certain kinds of interpretation.
For Now...
Given the above factors, I'm favoring the Harvard Global Health Institute's data analysis for a current picture of the coronavirus pandemic in Cedar Falls, in Iowa, and in the nation. I've explained my logic to city council members, and will be working with staff to develop a rubric for actions warranted at various HGHI levels. For instance, should we be holding electronic city council meetings until we're at least below HGHI's "10.0" level? Or should we wait until we're at less than "5.0"? When can we stop doing temperature checks in City Hall? Answering basic questions like that will help us set (hopefully) reasonable expectations for the residents of Cedar Falls. It will take time to create this guidance, but I just wanted to be perfectly open about the scale I currently prefer for understanding the Coronavirus trend, and why. And I refer to www.Blackhawkcovid19.com for local data not available on the HGHI site.
https://globalepidemics.org/key-metrics-for-covid-suppression/
Final Takeaway
This ongoing public health emergency is a disaster like no other. We're in this for the long haul, at least until a vaccine is readily available. I'll continue working closely with our county, state, and federal partners to obtain and use the most helpful data and analysis possible. As new tools come online, I'll add them to our local policy-making toolbox so that we can make the best decisions possible for our community. If you have additional tools or resources, please send them my way for consideration. That said, I reserve the right to be wrong. Epidemiology is so hard, I can't even comprehend how hard it is. I don't pretend to be a medical expert, just an elected official who happens to have some training in research methods. If I'm wrong in my interpretations above, I'll change direction based on new evidence.
Thanks for reading to the end!